

The report is conducted in English, the official company language, reflecting the organisation’s increasingly diverse talent pool.
Part one
Analysis of gender equality and causes
Simployer had a salary analysis and benchmark conducted via a third-party provider - Human Capital Analytics, AON. By applying classifications via AON job codes and Radford level the group has been able improve the current internal benchmark analysis in pay gap and gender equality.
The analysis is based on gross monthly pay levels per December 2024 and compares the average salaries per job code within departments. The gap remain at 1%.
Key figures for gender equality
as of December 31, 2024
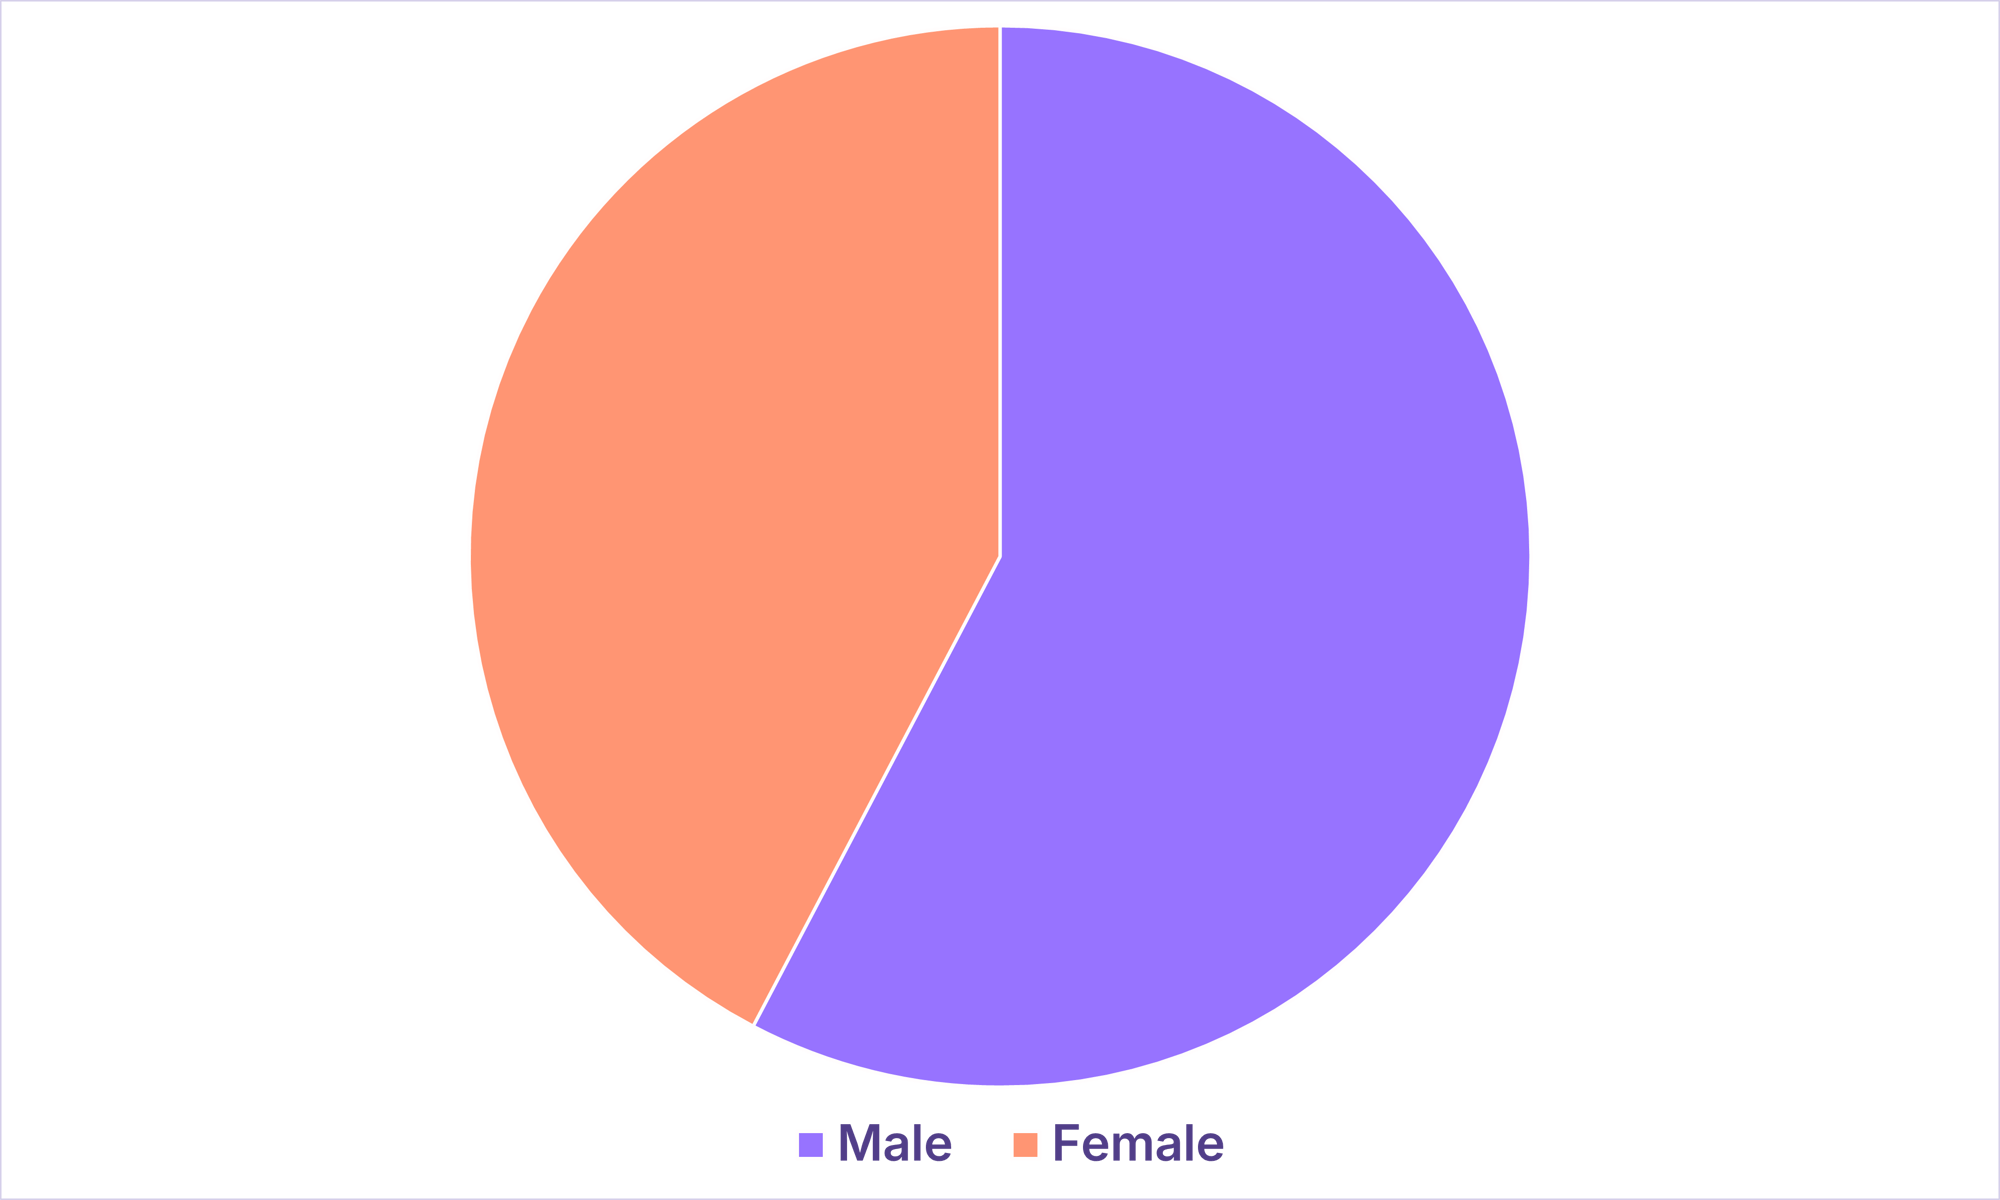
Gender balance
Women make up 42.3% (41.7% FY23) and men 57,7% (57.8% FY23), and 0.0% (0.5% FY23) have not stated their gender.
The proportion of new employees in 2024 was
- Women 46.6% (45.5% FY23)
- Men 53.5% (54.5% FY23)
Using an internal department mapping and naming the distribution of Female and Male per department is illustrated below. Overall ‘female’ is overrepresented in areas such as HR & Finance as well as customer success while ‘men’ is overrepresented in areas such as Technology and ICT.
|
Norway |
Female |
Male |
|
Management |
0 % |
100 % |
|
Finance |
56 % |
44 % |
|
People & Culture |
100 % |
0 % |
|
Product |
63 % |
38 % |
|
Technology |
9 % |
91 % |
|
ICT |
25 % |
75 % |
|
Customer Success |
79 % |
21 % |
|
Professional Services |
42 % |
58 % |
|
Customer Care |
50 % |
50 % |
|
Revenue Operations |
43 % |
57 % |
|
Upgrade Project |
0 % |
100 % |
|
Marketing |
67 % |
33 % |
|
Sales |
43 % |
57 % |
|
Experts |
58 % |
42 % |
|
Learning |
50 % |
50 % |
|
Norway |
Female |
Male |
|
G&A |
47 % |
53 % |
|
Customer |
53 % |
47 % |
|
Marketing |
67 % |
33 % |
|
Product |
63 % |
38 % |
|
Sales |
43 % |
57 % |
|
Technology |
9 % |
91 % |
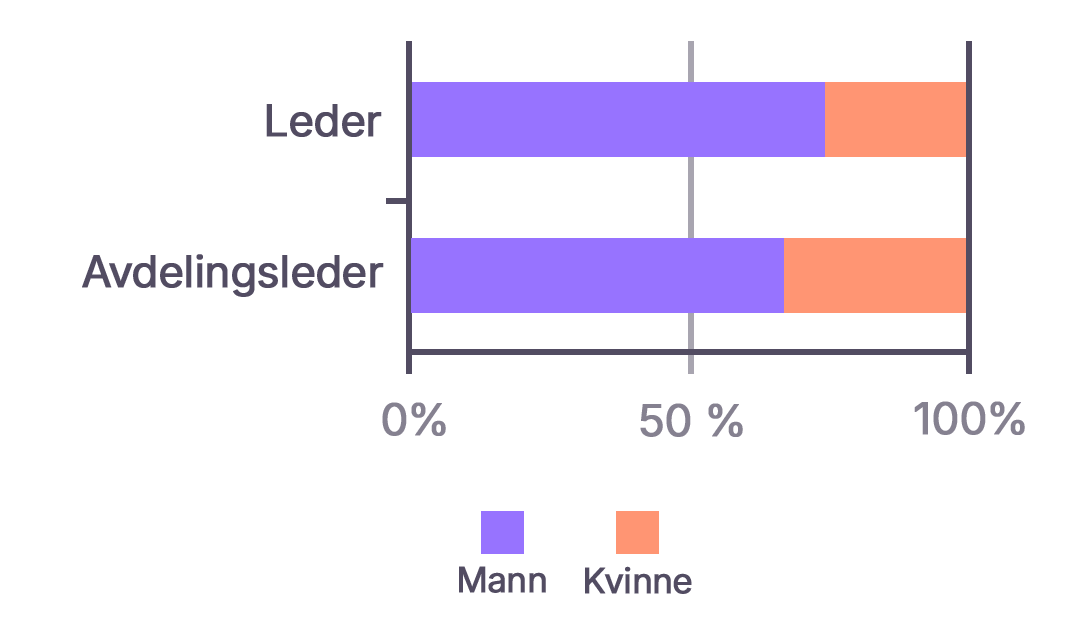
Leaders
Applying the Radford job codes ‘Leaders’ are defined as individuals with a job code that starts either with an ‘E’ (Executive) or ‘M’ (Management).
There are a total of 24 employees within the job code range
- Women; 8 employees a 33,3% representation
- Men; 16 employees a 66,7% representation
We remain committed to increasing female representation in leadership by encouraging and training women for leadership roles. Our key initiatives include targeted leadership development programs, Leadership lab and inclusive talent identification.
We recognise that there is still work to be done. We remain committed to measuring our impact, gathering feedback, and refining our approach to achieve meaningful change. Moving forward, we will continue to assess participation rates, track career progress, and seek input from employees to enhance our initiatives.
Part-time employees
3 women and 2 men work part-time as student workers. Part-time work is perceived to be voluntary and justified by family circumstances or studies.
Temporary employees
The group did not have any temporary employees other than hourly paid student workers
Parental leave
During 2024 the group had registered 222.2 weeks of parental leave (213 weeks FY23) The split of parental leave between male and female is as follows:
- Female 93.2 weeks representing 42%
- Male 129 weeks representing 58%
Sick-leave
Sick leave statistics extracted from the central HR-system indicates that there has been a higher sick leave among the ‘female’ population.
|
Organisation |
Male |
Female |
|
Simployer AS |
3,0 % |
7,0 % |
|
Simployer Group AS |
2,9 % |
0,8 % |